
ODIs – One siDed International Series?
In the UK, you may be paying £100 or more to watch the England team play in a one day international (ODI). Based on the ODIs of recent years, you have around a one in ten chance of seeing a match with a tight, even thrilling climax. On the other hand, you are three times as likely to see one of the teams trot to a comfortable victory (margin of over 100 runs or with ten or more overs to spare).
The spectating experience depends on much more than whether the match delivers jeopardy to the very end. But the competitiveness of the format is topical and a feature that the game’s administrators appear to want to promote.
The evidence for my assertion that there is a one in ten chance of seeing a thrilling finish to an ODI can be reviewed in my post ‘Thrilling finishes and the 50 over game’. In this article, I extend that analysis by updating the sample to February 2019 and by reviewing the competitiveness of ODI series.
In the 12 months since my earlier post, there has been something of a revival of the tight ODI. Spectators in this period have had a one-in-five chance of seeing a game with a thrilling finale. The criteria I use for defining tight matches comprise: a tie; a victory batting first by fewer than 10 runs; if chasing, winning in the final over or with eight or nine wickets lost.
On the other hand, there has been no let-up in the incidence of crushing victories: 34% by margins of over 100 runs or with more than ten overs to spare.
The overall picture since the 2015 World Cup is depicted below.

One-sided or closely matched series?
This analysis is based on the 79 series of three or more ODIs played between two teams since the 2015 World Cup and completed by the end of January 2019 (note 1). It omits shorter bilateral encounters and tournaments involving three or more sides – all of which are included in the match analysis chart above.
The table below summarises the results by series duration. One-half of series remained undecided heading into the final match. Sample sizes are small, but shorter series (three matches) were more likely to deliver a final match with everything to play for.

The unwanted spawn of the uncompetitive series is the dead rubber. Matches that had no bearing on the series outcome occurred 44% of the time that they could potentially have happened. Of the 52 dead rubber matches that went ahead, eleven ended up as consolation victories for the series loser. Six of the games (11.5%) produced ‘tight’ finishes, but 22 (42.3%) were crushing victories. The value of these games, other than selling air-time and bringing international cricket to more towns and cities is questionable.
A useful benchmark of competitiveness can be found in Test cricket. In Test series in the same period, 55% of the 36 series with three or more matches were wrapped up before the final game was played, creating dead rubber games. ODI series, therefore, have recently been more competitive than the Test match equivalent. Moreover, the Test match draw raises the probability of teams playing that format reaching the last game of a series with the result undecided.
Looking more broadly – at pure probability – gives further evidence that ODI series are not particularly uncompetitive. A ‘best of three’ coin toss would produce a definitive result with the first two tosses one-half of the time; five percentage points higher than that seen in three match ODI series.
The five (or more) match series, presents a more mixed picture. A definitive series result was obtained from the first three games in over one-third (34%) of match-ups – compared to 25% in a ‘best of five’ coin toss. The seven clean sweeps (18%) is three times the likelihood of five coin tosses ending all heads or all tails. Yet, 45% progressed to a fifth match decider, exceeding the expected 37.5% in the coin toss scenario.

In conclusion, ODI series sustain interest to their conclusion relatively frequently. The problem the format faces perhaps isn’t uncompetitiveness, but inflexibility of scheduling. On the occasions that a series is decided early, the remaining fixtures have been booked with broadcasters and grounds, who have sold ad space and tickets. The show must go on, even if intensity and interest decline.
Note 1: 3 match series in which either the first or second scheduled match was abandoned or cancelled are excluded (ie considered as 2 match encounters). If the third match was a victim of the weather, the series is included in the analysis.
Thrilling finishes and the 50 over game

YouTube still – Ramakrishna Chowdry
…Allan Donald standing, turning, dropping his bat, then running, but too, too late, as the celebrating Australians converge (Edgbaston, 1999)…
…Ajmal Shehzad clubs a first ball six as England’s 8th wicket pair gather 13 runs from the final over to tie the game on the final ball (Bengalaru, 2011)…
…Grant Elliot launches Dale Steyn over long-on, over the boundary from the penultimate ball of the 2015 semi-final… (Auckland, 2015)
These are the dramatic conclusions to One Day Internationals (ODIs) that come to my mind when I think of what makes the 50 over format so exciting. Matches that have run for hours but are decided by a pressure-forced error or a single audacious act. Games when all 22 players look back and can each reflect on just one thing had they done differently – pushed to turn a long single into a two; not bowled that wide; collected the ball cleanly on the boundary – that may have made all the difference.
Major tournaments are felt to be smouldering, not truly catching alight, until they feature at least one of these thrilling finishes. TV stations shelving the next scheduled programme so they can stay with the action until the very end. Pictures of fans chewing fingernails, or covering their eyes from the spectacle that both holds them rapt and that they cannot bear to watch.
Thrilling finishes seem to be the essence of one day, limited overs cricket. Yet how representative are they of the format? How often is the team batting second still chasing in the final over, or with their lower order batsmen stretching for the target? To approach an answer to these questions, I have analysed results and victory margins for ODIs since the last World Cup (March 2015 – January 2018). To provide some context for that analysis I have completed similar reviews of national, list A competitions and two non-full member 50 over tournaments from this year.
To be engaging, ODI cricket doesn’t have to culminate in a final over where all three results are possible. 100 overs gives plenty of opportunity for fortune to swing back and forth, with the final decisive swing happening deep into the second innings and producing a convincing margin of victory, rather than a nail-biting conclusion. An individual innings or bowling spell may blow away the opposition, yet provide adequate reward for the spectator or viewer. But still the sport yearns for the crazed uncertainty of a match that hinges on cricket’s high pressure equivalent of the duel.
The ODI sample I have assessed comprises 312 completed matches: 157 won by the side batting first; 153 by the side chasing; and two ties. The tied matches (0.6% of the total) qualify automatically as thrilling finishes.
Looking at the matches won by the side batting first, 13 (8.2%) were won by single figure margins (fewer than 10 runs) and so were likely to be in the balance going into the final over. Another 12 had victory margins of between 10 and 19 runs and so delivered some degree of jeopardy for players and fans deep into the game.
The chart below shows the distribution of victory margins for sides batting first (one decile is 10% of the matches in this sample). Not only are tight finishes relatively rare, but substantial wins are the norm: the median victory is by 70 runs and almost 30% of matches are won by 100 runs.

ODIs won by the team chasing were unresolved until the final over on 10 occasions (6.7% – excluding five matches decided by Duckworth Lewis when the side batting second was already ahead of the par figure when weather intervened). 27 (18.2%) reached the target in the penultimate over. Over half (14) of these had five wickets or more in hand, suggesting a well-calibrated chase rather than genuine uncertainty over the result.
The tactic of chasing teams to set a pace to their innings based on the target set, rather than the optimum score they might achieve, can make victory margins based on ball remaining in the innings misleading. Nonetheless, the chart below, showing the distribution of balls remaining in matches won by chasing teams, again shows that convincing victories are far more common that thrilling conclusions. The median margin is almost five overs and more than 30% of these games are won with 10 or more overs to spare.

A chasing side, of course, risks losing a game by being bowled out. There were eight (5.4%) instances where the game was won by one or two wickets. Five of these are already recognised as tight finishes as they finished in the last or penultimate over. At the other extreme, 35 games were won with the loss of three or fewer wickets.
Of the 312 completed matches in the sample, 28 (9.0%) appear to have delivered a truly tight game to the end, giving about a one in eleven chance of seeing a thrilling finish. Those do not seem unreasonable odds of a game staying alive until its very last passage of play.
More concerning is that 30% of the sample produced games that were not just comfortable victories but, achieved by margins of over 100 runs or with more than 10 overs to spare, were veritable blow-outs. Excluding matches involving non-Test playing nations made little difference to the incidence of crushing defeats/victories.
International sport has in-built inequalities with the population size and wealth of countries acting as constraints on their performance. The same is less true (although it remains a feature) of domestic sport where counties, states, provinces and clubs are able to recruit to strengthen sides and players migrate to where there are better opportunities to play. List A (i.e. top level domestic 50 over competitions) matches, therefore, provide something of a control sample to test whether the frequency of one-sided ODIs is a function of the match format or of international competition.
I drew my sample of domestic 50 over matches from the most recently completed List A competitions in Australia, South Africa, Pakistan (2017/18), England (2017), India, New Zealand and West Indies (2016/17). The results of 315 completed matches were analysed.
Using the same criteria for a thrilling finish (victory margin: batting first < 10 runs; chasing in last over or by 1 or 2 wickets; or a tie), there were 51 (16.2%) games that stayed alive until the very end. With odds of a little over one in six, List A matches produced tight finishes nearly twice as frequently as ODIs.
At the other extreme, trouncings were also rarer – but only slightly. 28.6% of the matches were won by 100 runs or more or with 10 or more overs to spare.
There were significant variations between the national competitions. England and New Zealand produced closer matches – shown below with the median margin of victory for each competition. The incidence of games curtailed by bad weather and decided on the Duckworth Lewis system may have played a part in creating closer finishes in those two countries.

Returning to international competition, two recent tournaments provided contrasting records for tightness of matches. At the 2018 under 19 World Cup, the median margins of victory were:
– batting first: 101 runs (ODI median: 70 runs)
– batting second: 63 balls, 7 wickets (ODI median: 29.5 balls, 6 wickets)
Only two of the 48 matches in the tournament (4%) met my criteria for a very close finish: batting first – victory by less than 10 runs; batting second – victory in final over or by two wickets or less.
Fans of thrilling finishes should pay attention to World Cricket League, Division 2. Six of the eighteen matches in the recent tournament qualified as very close finishes, with one team featuring in four of those games. On that basis, Nepal deserves to be the favourite team of every cricket fan who cherishes the tension of a 50 over game fulfilling its potential of going down to the wire.
A series of missed opportunities: India v England 2016

Rashid drops Kohli in the 2nd Test
In the Test match in Mumbai, there was a lot said about the fact we played four seamers and two spinners… [but] if we’d caught our catches, we wouldn’t have been talking about our combination; we’d have been talking about how we probably had a chance of winning a game of Test cricket. But consistently, we’ve missed chances – and you can’t afford to do that against the best teams in their home conditions.”
Paul Farbrace – Assistant Coach (speaking after 5th Test at Chennai)
The focus on England’s dropped catches in the series in India is understandable given that, in four of the five Tests, one or more of India’s first innings century makers was dropped early in their innings. Vijay, Kohli (twice), Jayant Yadav, Karun Nair accumulated a combined 649 runs from five innings after an initial escape. England committed seven drops in those five innings and a further eleven across the whole series. Understandable but, in the round, is it justified?
Using ESPNcricinfo’s ball-by-ball commentary, I have recorded each chance of a catch given during the series. I have included any chances that went to hand (or body) and those described as passing between two adjacent fielders. Excluded are balls that looped out of reach, or fell short of, fielders making reasonable attempts, as well as those that passed where one might have expected there to be a fielder, but there was not.
The raw results are shown in the table below. India committed 26 drops compared to England’s 18 and converted a lower proportion of chances into catches.
| Chances | Catches | Catch % | |
| Ind | 76 | 50 | 66% |
| Eng | 65 | 47 | 72% |
In October 2016, Charles Davis published in The Cricket Monthly a summary of the results of his analysis of almost 15 years of fielding errors in Tests – Tracking the Misses. Courtesy of Davis, it is possible to put into context the numbers from the India v England series (NB Davis included stumpings in his data, which I have not).
Davis found around 25% of opportunities were missed in the field – an average of seven per Test match. In this series, 31% were missed – 8.8 per Test. Both sides under-performed their recent record: England 24.8%; India 27.2%. This comparison does support the view that fielding errors were a feature of the series. But is it simply losers’ regret that has the England team pointing at missed opportunities? They did, after all out-perform India in terms of the proportion of catches taken.
England, as hinted at above with the roll call of India’s century makers who were dropped, bore a higher average cost for the chances they missed. The mean number of runs scored by an Indian batsman after a drop was 44 (median 22). The equivalent figure for England was 28 (median 21) [footnote 1].
The contrast is most acute when looking at the two captains. Cook was dropped six times (the most of any player) but only added 134 runs. Kohli made 282 runs after the three misses he benefited from.
The two captains were also the most frequent offenders. Cook shelled four of his seven chances; Kohli could not hang onto five of his ten catches.
This analysis supports the conclusion that England, had they taken their opportunities, would have shifted somewhat the balance of the series. However, I believe there are associated conclusions that are probably more profound about the cricket England and India played.
India’s ability to limit the damage of their fielding errors was a great strength: their bowlers were able to continue to create opportunities. England’s bowlers, on the other hand, lacked the penetration to keep their opponents under the kind of pressure that would, sooner rather than later, lead to another wicket-taking opportunity. Moreover, England were significantly more reliant on their fielders for taking wickets. 72% of the wickets taken by England in the series were catches. India’s equivalent figure was almost twenty percentage points lower (53%). Ashwin and Jadeja, in particular, threatened the England batsmen’s stumps to an extent unmatched by the England attack.
The argument that England’s fortunes were hampered by their inability to take the catching chances that came their way obscures the greater insight that England were over-reliant on snatching any opportunities falling to their fielders because they were unable to trouble India’s batsmen often enough and in a sufficient variety of ways.
————
Footnote 1 – in calculating the number of runs scored by a batsman after a drop, I have subtracted the score when dropped from either their innings end score, or in the case of batsmen dropped more than once in a single innings, from the their score when they were dropped again.
Getting the point: County Championship bonus points

The climactic last overs of the 2016 County Championship were made possible by a thrilling afternoon of cricket, by the captains’ horse-trading and by a tense passage of play that took place one day earlier.
Yorkshire, in the form of Tim Bresnan and lower order partners, were batting on Thursday, trying to set as high a first innings total as possible. How high? At least 350 runs high.
Run number 350 was the 16th run of the 10th wicket partnership between Bresnan and Ryan Sidebottom, which, to emphasise the drama, had included an hour’s break for rain after 15 of those runs had been scored. With it, Yorkshire accrued their fourth batting point, and so the ability to overhaul Somerset, should both Somerset and Yorkshire win their final matches of the 2016 season. Without it, that singular bonus point, Yorkshire could not have won the title and so would not have risked all on chasing the win in a manner that could gift the match to Middlesex. Somerset would, in all likelihood, have become County Champions.
Since 1968, the County Championship has been decided by a scoring system comprising: points for match results, combined with points for runs scored and wickets taken in each side’s first innings. The system has been tweaked – draws not scoring points in some seasons, alterations to the thresholds for first innings runs and wickets and the overs in which they can be earned, and fluctuations in the value of a victory. The rules for the 2016 season can be read here.
The bonus point gained when Sidebottom flicked the ball to fine-leg on day 3 was essential for the drama to unfold at Lord’s on the final day of the 2016 season. This post considers how important bonus points are in the County Championship and whether they fulfil their objectives.
Bonus points accounted for 44% of the points scored across the two divisions of the County Championship in 2016. The chart below shows the bonus points earned by each side in the 2016 County Championship (net of penalty points). It shows that bonus point totals are only loosely correlated with the position counties achieved. While one bonus point can swing the season, a season’s worth of bonus points will not necessarily decide the title.

I (with the help of Twitter correspondents) have identified three objectives against which the bonus point system can be tested:
- acting as a tie-breaker between teams with similar records
- rewarding teams for their performances in matches which do not reach a positive result
- incentivising positive cricket in the early part of the game.
Scorecards and conventional records allow some analysis of the first two of these objectives.
Bonus points as tie-breakers
Most tie-breakers in sports are secondary assessments, happening after the tie occurs (e.g. super over in T20 knock-outs) or on a count-back basis after the primary scoring system delivers a draw (e.g. goal difference in football). In the County Championship, the points for first innings performance are aggregated with those for wins and draws as primary determinants of league position.
It’s feasible that bonus points can be tie-makers (or unsuccessful tie-breakers). This has happened once in the 49 years of their use in the County Championship: 1977. Middlesex and Kent both won 9 games (as did Gloucestershire), but Middlesex lost three more games than Kent. There were no points for draws in 1977, and with an identical number of bonus points (119), the title was shared.
Nearly forty years later, with the County Championship operating as two divisions, as well as fewer matches being played, there is potentially more need for a tie-breaker to help decide champions as well as the relegation and promotion places. To assess the impact of bonus points as tie-breakers, I have re-scored the championship, without bonus points and using three different points allocations for wins/draws/losses: 3/1/0; 6/1/0; 5/2/0. The occurrence of end of season ties over the last ten years, had points only been available for match results, is shown in the table below.
 Bonus points have successfully prevented ties in key end of season positions, which would have occurred occasionally, not routinely.
Re-scoring the championship in this way shows another significant impact of the bonus point system – how it produces different outcomes to a result-only points system. Most notably, in 2010, under two of the alternative points systems I used, Somerset not Nottinghamshire would have been Champions. The Cider-men once again denied by bonus points. Promotion and relegation outcomes would also have been different in several years.

Bonus points to reward teams for performance in drawn matches
Drawn matches occur frequently (51% in the County Championship in 2016; up from 35% in 2015) and can leave a game at its conclusion anywhere from one team clinging on nine wickets down, 200 runs behind to a deadlock of two long, high-scoring first innings and on again to matches washed out before any telling advantage has been gained. There is a case for rewarding teams, whose hard won advantage cannot be converted into a victory, particularly when the weather is responsible.
I picked at random ten drawn matches from the 2016 season, to see if bonus points fulfilled this role.
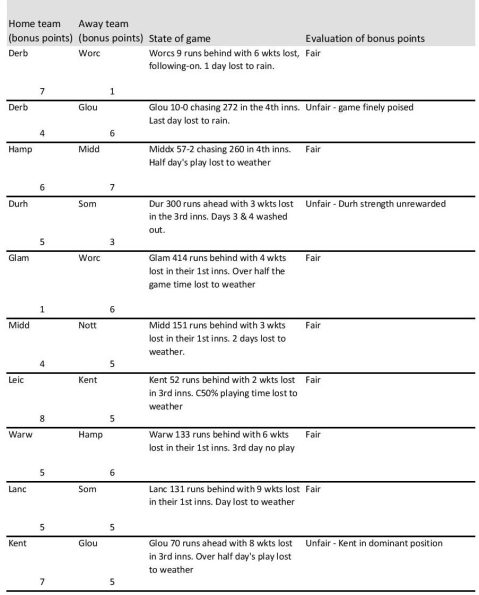
I found that in the majority of this sample of drawn games (7/10) the allocation of points was fair when weighed against the state of the game at its close. Where it wasn’t, it was because the balance of the game altered after the 110 over bonus-point period of each first innings, often in the third innings. For the same reason, the absolute number of points gained, was not strongly related to the likelihood that a team would have won from the position gained at the close of play.
Bonus points to reward positive play
The Editor’s notes in the 1969 edition of Wisden recorded that:
the introduction of bonus points for positive batting and successful bowling during the first 85 overs delivered by each side, produced keener cricket in the early stages of the three-day matches. The batsmen discovered the freedom that has been there all the time.
An early success, then. But, as long-in-the-tooth cricket watchers now witness daily, positive batting has become the default approach for most players. Perhaps bonus points are no longer needed to tease it out.
In conclusion, bonus points prevent teams ending the season tied, although ties would be quite unusual if points were only available for match results. Bonus points have, from-time-to-time, delivered league positions that don’t accord with the positions of teams had they been based on match results. On these occasions, bonus points have been going beyond the role that I have imagined for them as tie-breakers. Bonus points have been needed as tie-breakers as often as they have directly influenced league positions when not required as tie-breakers.
The sample of ten drawn matches suggests that bonus points, more often than not, provide a fair reward for performance in matches without a positive result. But, the allocation of bonus points, based on first innings runs and wickets, understandably does not always reflect the state of the game when time is called.
Nearly 40 years ago, soon after their introduction, bonus points were recognised in Wisden for promoting more positive play. With most modern batsmen committed to attack, they may no longer play a useful function as incentives to play positively.
Bonus points are often superfluous and yet sometimes telling. Points based on match results alone would, in most seasons, be sufficient to identify champions, promoted and relegated teams. Given match results are the solid currency of the sport, I would recommend points awarded on that basis should be the primary determinant of league position. A tie-breaker would still be necessary. Bonus points, recorded as a secondary measure, could play that role – but so could other, simpler systems.
In defence of Keemo Paul
 The final over run out of the Zimbabwe non-striker, Richard Ngarava, to give the West Indies victory and passage to the quarter finals of the Under 19 World Cup has detonated a full spectrum of opinion from cricket followers. I will construct a defence of Keemo Paul, the West Indian bowler who completed the run out, and argue that the rest of this tournament and the World T20 that follows shortly will be better contests because of his action.
For cricket-law essentialists, Paul and his captain Shimron Hetmyer, who confirmed to the umpires that he wanted to uphold his bowler’s appeal, acted within the Laws and so should not be questioned. Allied to this position is the contrarian, and often humorous, cabal who celebrate anything that discomforts those who argue for cricket’s lofty role while not applying the rigour that spots double standards and inconsistencies. And this incident most definitely discomforted this group.
But the conclusion to today’s match also sat uneasily with many who know the Laws and how to negotiate them and have long, unsentimental experience of playing, watching and officiating cricket. That uneasiness was partly because a game, boiling up into a grand finale, was cut short. No stumps were splayed, no batsmen frantically scampering home or fielders flinging themselves to stop or miss a ball. It was an unworthy end: the game of bat and ball abbreviated before bat even had a say in the matter.
More strongly than that, I suspect, was the notion that Paul had tricked Ngarava into his demise and not that Paul had caught Ngarava stealing down the pitch sneakily. I admit that seeing the footage, I immediately inclined to this view. The non-striker is standing, not advancing, bat in conventional fashion leaning back towards, but sadly not inside the crease. It took the third umpire to confirm that the motionless Ngarava’s bat was grounded on the line. Paul had no intention to bowl and participate in the contest that could win or lose his team the game.
Seeing that one ball, in isolation, it is easy to come to that view. Paul is the villain, who exploited the grey area between the Law on paper and how the game is played. Paul’s vindication comes, I believe, by looking beyond that single ball to the situation of the match.
Zimbabwe were nine wickets down, three runs from victory. Their last pair at the crease were in the team as bowlers. The senior partner, Matigimu, had scored a boundary – from his inside edge, past off-stump to the fine-leg boundary. There was a looming possibility that the match would end with batsman, keeper, fielders converging, sliding, diving towards the stumps. It could come down to a scrambled single from a mishit, deflection off the pads or ball running through to the keeper. We’ve seen so many matches end this way. And the odds are loaded in favour of the batting team when the non-striker leaves the crease early for this last mad dash.
If Paul, trusted (or burdened) with bowling the last over of the match, was to take his team to victory, he had to guard against singles scored from mishits and misses. He had to even up the odds. To wait to see if the batsmen were adventurous runners would be to act too late. There’s no complaints mechanism, or dispute resolution for the fielding team that sees a non-striker dashing to the danger end before the ball leaves the bowler’s hand. There’s just frustration and disappointment. Paul’s was a calculated decision to run in first ball and dislodge the bails.
Cricket’s lines are governed in two ways. Some lines – front and back foot no-balls, the creases when batsmen are turning after completing runs – are policed. Other lines – for example, the batting crease – are managed through competitive tension. With the former, the umpires have control. With the latter, the opposing players check each other’s excursions and retreats, jockey for advantage. The sport is better where competition is the governor. Policing of lines by umpires only happens where there is an absence of competitive tension. It is a necessary, but inferior substitute.
The position of the non-striker, relative to the crease, falls into the second category of line governance. The fielding team can rely on no policing of the non-striker’s move across and away from that crease. This is acutely, match-definingly crucial when a game is in the clutch. The fielding team must apply its own pressure and compete for control of that line. Surrender it, hope perhaps that the spirit of cricket will act as their proxy, and the single and with it the match is conceded.
Keemo Paul knew this and exerted pressure on the line; a pressure that would ensure any single run in that final over would have to be the full length of the pitch from, and not before, the moment he released the ball. It just so happened that his premeditated application of competitive tension caught the non-striker carelessly, not sneakily, out of his ground.
Paul’s action should now ensure that other matches in this tournament and at the World T20, coming to a tense conclusion, have batting and fielding teams competing over both ends of the pitch. Match-winning singles will have to be run in full, with guns jumped at the non-strikers’ peril.
It was clever, pre-emptive action that should eradicate future complaints and controversies about unfairness in close finishes. If I coached a cricket team, I would make it a tactical requirement of my side in the field to commit a Keemo Paul as matches approached their climax; and I would coach my batsmen to expect it to happen to them.
Short pitch: batting for the draw
I have played very little cricket where getting a result, any result is all important; and when I have, rarely has the balance of the game been tilted decisively at the half-way point.
“Just bat. Just don’t get out.”
That was the gist of the skipper’s instruction as I padded up, getting ready to open our innings after tea on Sunday. 270 was the target, but not one that I was being aimed at. 40 overs was my objective.
Whenever a Test team starts its second innings with nothing but crease occupation at stake, I pause for a moment to imagine being asked to bat and bat and carry on batting. Would it be liberating, to be freed from the pressure of scoring runs? Would you attain a focus and rhythm, with pulse suppressed and consciousness narrowed? Or would the fear of making a mistake cramp and sully what could be a pure exercise in staying at the crease, over after over?
I recall being involved in a rearguard for my club in the Kent League in the early 1990s. My partner and I were doing our honest best to suffocate the game. I have never been subjected to such foul abuse on the sporting field, or anywhere else, as I was by the fielding team that afternoon. I scoffed when I next came across that club, 20 years later, on an ECB sponsored video looking all prim and proper setting an example for involving volunteers in running junior cricket.
I may have conflated two matches, but I think I was eventually run out. I hit the ball to the pavilion boundary, where our players signalled a four. I was talking mid-pitch to my partner when the fielder returned the ball, the bails were removed and I was given out. I didn’t skrike like Ian Bell at Edgbaston. I was in the wrong: the umpire hadn’t signalled the boundary.
The invitation – the instruction – to bat as long as possible is then very rare. It’s a luxury to be revelled in; not an opportunity to spurn. But, not far below the surface, it feels self-indulgent. It’s the all you can eat buffet of the batting world, but with the risk, not of indigestion, but dismissal, unfulfilled, wondering how many runs you passed up.
All this talk is cheaper than a first-baller. How did I do?
I edged the first ball wide of second slip for four. I recorded eleven more scoring shots: ten singles and a two. Wickets fell regularly at the other end and the bowling was testing, particularly the young opening bowler. I managed to calm my instinct to have a dash at anything pitched up on or outside off-stump. There was one exception: the ball after I fended a bouncer away from my throat, that instinct rose and I swung and missed by some margin a ball wide of off. Thereafter, for the final third of my innings, my shot-shyness was assisted by only being able to hold the bat with one and a half hands (see reason here). The rest of the time, I was content to stretch out into a forward defensive, watch the ball pass wide of the stumps, or deflect the ball off my legs. It was a challenge of concentration and technique.
There was plenty of chirping from the fielding team – all of which felt justified given my aim was simply to spoil their afternoon with my virtual inactivity. And they did seem happy, when with momentary carelessness I played across a straight, short-pitched leg break, was struck in front and sent packing. It was the end of the 17th over, I had scored 16 and hadn’t completed half of my assignment.
Our lower order held on for the draw – in doing so, playing some attractive cricket. I would be daft to deny there is great pleasure in that, but there’s also something to cherish in taking up the invitation to “just bat.”
Quick single: the fourth innings 400 barrier
A lead of 400, entering the fourth innings of a match, is an impregnable position – virtually. A score that is routinely accrued in the early part of a match, becomes unattainable (almost) for the side batting last.
The trend of diminishing run-scoring returns as matches enter their final phase is one of the known, understood and acted upon patterns of cricket. There’s no mystery to it, not if you get close to the action and see the deterioration in the pitch that makes it less and less reliable for batting on as three or four days of play pass.
According to this list, Middlesex’s score of 405-5 against Somerset today is in the top 70 winning fourth innings totals in first class cricket history. This list spans 120 years, meaning that successful run chases of this size, or greater, occur slightly more than every other year on average. In fact, 13 came from the last decade, showing that their frequency is increasing, probably because the condition of pitches alters less as matches progress making run-scoring less hazardous deeper into a match and faster scoring rates mean that leads of 400 plus are achieved at an earlier point in games.
Nonetheless, they remain rare and noteworthy achievements (albeit Middlesex’s second in two years after scoring 472 against Yorkshire in 2014). And each time they happen, their effect is to make another occurrence both more and less likely. Teams facing a target of more than 400 have recent examples to emulate and may opt for the chase rather than survival. But teams setting targets, who can time when the fourth innings begins, will be a little more cautious, asking more in less time of their opponents. For a team on top after three innings, this maxim is particularly true: losing feels worse than winning feels good.
Graeme Smith declares
Graeme Smith’s Test career ended in defeat and South Africa’s first series loss in five years and 15 series. He must have drawn satisfaction from his final, albeit unsuccessful, day of Test cricket as his middle and lower order battled and came so close to eking a draw from a game in which they were profoundly outplayed.
Smith’s records as captain – most matches, most victories – have been celebrated. There’s another record he holds, less well known, but which makes the denouement of his final Test ironic. Australia won at Cape Town with time almost, but not quite, up after declaring in the third innings. Smith is the most prolific declarer in Test history, having called time on South Africa batting in the third innings of a match 25 times. Yet, only eight of those declarations were converted into victories – producing a success ratio of 32%, below the average for the game and a long way short of the proportion achieved in recent years of Test cricket.
South Africa have become known for being a team hard to beat and one that finds it hard to speculate to accumulate if the victory isn’t coming comfortably their way. Smith’s statistic of only converting 32% of declarations – made when ahead in the game – into victories gives fuel to this notion of a risk averse South African side. The purpose of this post is to assess whether, from the perspective of the target-setting declarations, this is a fair assessment of Smith’s career, which in so many respects deserves to be remembered for the effectiveness of his leadership.
Smith’s third innings declarations spanned from his third Test as captain (v England at Edgbaston in July 2003) to his 107th and penultimate Test (v Australia at Port Elizabeth). In total, these declarations yielded eight victories, 16 draws and a single defeat. How many of the draws were likely victories spurned through over-caution?
Three of the draws can be discounted immediately. These weren’t ‘target-setting’ declarations, but decisions to close the innings to end a match that hadn’t progressed beyond the third innings. Adjusting for these, Smith’s win rate increases to 36%. A further adjustment, to take out two games where the fourth innings was prevented by rain from running its course, lifts the success rate to 40%.
The chart below shows the target set and estimated number of overs remaining in the match for each of the 22 ‘live’ declarations (including the two rain-affected games). Matches that were won by South Africa are green, defeats in red and draws in blue. The dotted turquoise line indicates the current record fourth innings chase in Test cricket (418). On ten occasions, Smith has challenged opponents to set a new Test fourth innings record.

Smith’s teams have won each of the matches where they have given themselves over 150 overs (five sessions) to bowl out the opposition. They have won only one-third of the nine games when they had 100-150 overs. Not a single game has been won with the declaration leaving a day’s play (90 overs) or less.
To test for examples of over-cautious captaincy, it makes sense to start with the four matches where Smith set a target of over 400 and gave his team over 100 overs to secure the victory (a fifth, when the final day was rain affected is excluded). Should he have declared earlier?
In only one of the matches (v England, Cape Town – Jan 2010) does it appear, with the benefit of hindsight, that more overs could have delivered a victory. England were nine wickets down and 170 short of the target after the 141 overs were delivered. In the other matches, the opposition were three, four and five wickets down at the close of play. In each case, bringing forward the declaration by an hour would not have substantially increased the chance of a South African defeat, but may have helped a victory push, although that seems unlikely given the position of the game at the end of day five.
Teams batting third create time to bowl the opposition out by batting, if not aggressively, then enterprisingly. The chart below shows the run rate per over achieved by South Africa for each of the 22 ‘live’ declarations. The colour of the bar indicates the match result: green – win; blue – draw; red – defeat.

The picture is mixed. Three of the four third innings with run rates below 3 per over presaged draws. But three of the five third innings with the highest run rates were also in matches that concluded in draws.
Smith has earned praise for several of his declarations. The defeat against Australia at Sydney in 2006, when South Africa were 1-0 down in the final Test of the series, came about following a “sporting declaration” by Smith – and tremendous attacking innings by Ponting. His next declaration, against India at Durban in December 2006, showed no signs of being scarred by defeat. Smith set the visitors 354 at a rate of almost one run per over slower than his team had amassed their third innings total. He was rewarded with a comfortable victory and a squared series. At Headingley six years later, Smith was credited with “happy daring” when 1-0 up in the series with two to play, he set England 253 in 39 overs.
Taken together, these observations point to criticism of Smith’s negative approach as a captain when setting the opposition a target being overstated. There are examples where he could have ventured more in pursuit of victory. But there are also examples of bold declarations, just as there are of frustration in the face of stubborn, unanticipated fourth innings salvage jobs.
Where Smith’s team appears to vary from the norm in Test cricket declarations is the failure to convert the majority of situations where 100-150 overs remain in the game into victories. In an earlier analysis of target-setting declarations in Tests between 2009-11, All the time in the world, I found that only four of 17 (24%) declarations made with 100-150 overs left in the game resulted in draws. Smith’s career record is 67% (six of nine).
The key to Smith’s apparently low conversion of declarations into victories has not been the timing of his declarations, nor has it been the urgency with which his side has batted in the third innings of the match. If there is a deficiency it lies with the concoction of factors that have made South Africa relatively ineffective at dismissing sides in the fourth innings. In that mix may be: the lack of top quality spin bowling, unhelpful wickets, unadventurous captaincy in the field and, of course, ill-fortune. What do you think accounts for Smith’s mediocre record of driving home match advantage into victory?
Dead rubbers
 The Ashes series is decided. Australia have overwhelmed England at Brisbane, Adelaide and Perth. England’s squad is gathering itself for Melbourne and Sydney depleted by the withdrawal, retirement and impotence of first choice players.
Those of us protective of Test cricket laud the extended narrative of long series. We don’t hesitate to point out the unsuitability of the increasingly frequent two-off Test format that leaves so many contests undecided (two Test series = oxymoron). Yet, with the luxury of lengthy series comes the risk of one-sided contests rendering later matches irrelevant to the series outcome. It’s worth considering whether this lessens the significance and impact of the matches played. Firstly, though, a few numbers to evaluate how common the dead rubber is.
I looked at the progress of the 99 most recently completed series up until September 2013. 43 of these were two Tests in length; 41 lasted three Tests; ten of four Tests; and five of Ashes-length five matches. I extended the sample of four and five match series to 25 by adding the next ten most recent longer contests. It is worth noting an important bias in the data: longer (four/five Test) series are unequally distributed across Test playing nations. England contested 16 of the 25 series in the sample; Australia 11; New Zealand, Sri Lanka, Zimbabwe and Bangladesh 0.
The frequency of dead rubbers is shown in the table below.
| Series length | Series (no.) | Dead rubbers | Dead rubber % |
| 3 tests | 41 | 10 | 24% |
| 4 tests | 18 | 11 | 61% |
| 5 tests | 7 | 2 | 29% |
| 4 or 5 tests | 25 | 13 | 52% |
Over half of longer (i.e. four or five) Test series ended with matches that had no bearing on the series outcome, compared to one-quarter of three Test series. Only one series had the ‘double dead rubber’ we are about to experience – England’s last but one visit to Australia in 2006/07.
One step back from the dead rubber in terms of predictability of outcome, is the series which reaches the stage where only one team can win and the other draw (‘2 result rubbers’). This analysis draws in the two-off contests.
| Series length | Series (no.) | 2 result rubbers | 2 result % |
| 2 tests | 43 | 37 | 86% |
| 3 tests | 41 | 19 | 46% |
| 4 tests | 18 | 11 | 61% |
| 5 tests | 7 | 5 | 71% |
| 4 or 5 tests | 25 | 16 | 64% |
The vast majority of two-off contests saw a positive result in the first Test meaning that only one team could win the series. A much lower proportion of three Test series had one team going into the final match with a lead of a single victory.
Many Test rivalries are played out for a trophy. The convention that the most recent winner only has to draw the current series to retain the trophy means that encounters where only one team can win the series and the other draw it have the potential for great excitement. The Oval Test of 2005, with England needing a draw to regain the Ashes and Australia a victory to retain the urn, was an exemplar of this kind from recent years.
Series that enter their final chapter with all three outcomes possible can be the most prized.
| Series length | Series (no.) | All 3 results poss | % |
| 2 tests | 43 | 6 | 14% |
| 3 tests | 41 | 12 | 29% |
| 4 tests | 18 | 2 | 11% |
| 5 tests | 7 | 1 | 14% |
| 4 or 5 tests | 25 | 3 | 12% |
This eventuality is as equally unlikely a culmination to a five Test series as it is to the abbreviated two-off contest. The three Test series most frequently delivers the ‘everything to play for’ finale. Cricket is a confounding sport, so it’s worth recording that not all series that enter that last match with everything at stake should not be cherished. Two high scoring bore-draws can presage an equally turgid third and indecisive Test match.
To consider whether matches in dead rubbers are a dead loss or are fought to the death, I’ve looked at the actions and outcome of the 23 dead rubber matches in the sample.
The majority (13) were won by the team that had already secured the series victory (included here was the match awarded to England in 2006 when Pakistan refused to take the field after being penalised for altering the condition of the ball). While that provides evidence that the winning team remains motivated to pursue the win, it does suggest that the dead rubber adds little to what we already know about the relative strengths of the two teams.
Four of these matches were won by the team that had lost the series. In early 2009, Australia and South Africa played home and away three match series – virtually a six match series across two continents. In an unexpected symmetry, the host lost the first and second matches of both series before recording a home win. The home teams also gained consolation victories in the other examples: England defeating South Africa in 2008 at the Oval in Kevin Pietersen’s first match as captain; and a thrilling victory for India in Mumbai in 1994 when Australia were skittled for 93 and a 13 run defeat.
The remaining six dead rubbers produced draws. There were some notable matches, including: Lara’s 400* for the series losers; Sri Lanka running out of time 101 runs shy of a world record 4th innings target with six wickets in hand. There is also the strong rebuttal to the notion that dead rubbers don’t matter from November 2011 in Mumbai. India, series victors, were set 243 to win the third and final Test. The match went to the last ball of the final over with India’s tenth wicket pair managing a single to bring the scores level.
While dead rubbers have been the occasion of some very notable cricket, on the whole, the sport would be better without them. In this sample, series comprising three Test matches provided the most sustained uncertainty over the series outcome. Nearly half of longer (four and five Test) series, fulfilled the final fixture with honours already awarded. My recommendation would be that three Test series should be the norm. Longer series should be reserved, as they are now, for the traditional marquee series, but also any contest between, say, two of the top three ranked teams in the world. This would require some flexibility in scheduling, something the BCCI has shown in 2013 is very feasible. Two-off contests should be limited to match-ups between teams separated by five or more places in the rankings.
Later this week, the first of two Tests starts with the Ashes already decided and the rubber, strictly, dead. The onus is on England to breathe some life back into the contest.
___________________
Do leave a comment, or tweet me, with your views of preferred Test series lengths and also of memorable dead rubbers.
Have I idealised the 2005 Ashes victory?

You will know very well that England retained the Ashes in August.. that the victory margin was 3-0, not really reflecting the tightness of the contest but, perhaps, England’s ability to seize opportunity.. that there were some notable performances, Harris, Bell, Swann.. and that there was a preoccupation with the game’s periphery of conduct, decision-making, playing conditions – much of it well-grounded in concern for the game’s direction.
I have been bothered by a particular strain in the English post-series coverage. It is exemplified by George Dobell, Cricinfo’s senior correspondent. Dobell published a piece the day after the series ended that summarised those seven weeks of action (and debate) with the precision and nuance that explains why he gets paid for his writing and most of the rest of us are readers or hobbyist bloggers. But it is these opening paragraphs that gave me a jolt – part annoyance and then a commitment to self-examination:
It is remarkable how demands change. A decade ago, any Ashes victory would have been celebrated as a stunning achievement. It is not so long ago it warranted an open-top bus parade through the streets of London and MBEs all round.
Now, it seems, the bar has been raised. Victory is not enough. England are not expected just to win, but to win with style and flair and grace. Despite the 3-0 result, they have been criticised for their perceived negativity, their perceived gamesmanship and their perceived limitations. They are judged by far harsher criteria than they used to be. They are the victims of their own success.
I read Dobell as saying that what has changed since 2005 is us – by which I mean England cricket followers – rather than the substance of the matter changing – by which I mean the achievement.
Dobell is, of course, right that we (England cricket followers) have changed over the last decade. We are prouder of what the team has achieved, less prone to self-deprecation and, as he asserts, more demanding.
There is another difference between 2005 and 2013 and it surprises me that I need to express it. 2005 was the most thrilling, emotionally-draining, awesome cricket series of my life-time. Better than 1981, 1986/87 and 2010/11. Definitely better than 2013.
I have the good fortune to be very happily married, with three healthy, fine kids. I enjoyed academic achievement, some professional progress and a smaller, but sweeter, amount of sporting success. I have lived on three continents, travelled to some of the world’s great cities and sights. Yet, the Ashes of 2005 is right up there amongst my most cherished memories.
I will assume a good deal of knowledge of my readers and so state as barely as I can that in 2005:
- Australia had two of the finest bowlers in history, a behemoth of a batting line-up with a wicketkeeper who redefined that role.
- England won after falling behind in the series, with the results of Tests 2-4 in the balance until very late in each game and the series on the line until late on the fifth afternoon of the 5th Test
- England played positive, nay aggressive, cricket throughout the series, scoring quickly and attacking the Australian batting with the most compelling combination of four fast bowlers offering swing, pace and bounce.
Dobell is not just a top correspondent, but he has the good grace to engage with his readers. I tweeted him with a very abbreviated form of this argument after reading his article. An extract of the exchange is below:

His response was to point to this current England team’s finest achievement – victory in India. That result was unexpected, so rarely are India defeated at home, albeit the opposition was indulging its old guard rather than bringing in the new, who already seem to have galvanised the team. Either way, it’s a distraction – it’s the achievement of the England team this summer that is at issue.
So, self-examination has led me to entrench my position: the England team of 2013 received the level of acclaim for their Ashes victory proportionate to their achievement, which is notches below that of the 2005 team.
Or, have I just idealised the 2005 Ashes victory?
